Evaluating and Integrating Data
Evaluating and Integrating Data
Effective readers do more than absorb and analyze the content of sentences, paragraphs, and chapters. They recognize the importance of features that stand out in and around the text, and they understand and integrate knowledge from visual features like maps and charts.
Text Features
Elements that stand out from a text are called text features. Text features perform many vital functions.
- Introducing the Topic and Organizing Information
The title on a fictional work does not always state the topic explicitly. While some titles do this, others are more concerned with hinting at a theme or setting up the tone.

- Titles – The title of a nonfiction text typically introduces the topic. Titles are guiding features of organization because they give clues about what is and is not covered. The title of this section, “Text Features,” covers exactly that—not, for example, implicit ideas.
- Headings and Subheadings – Headings and subheadings provide subtopic information about supporting points and let readers scan to see how information is organized. The subheadings of this page organize text features according to the functions they perform.
Helping the Reader Find Information
- Table of Contents – The table of contents of a long work lists chapter titles and other largescale information so readers can predict the content. This helps readers to determine whether or not a text will be useful to them and to find sections relevant to their research.
- Index– In a book, the index is an alphabetical list of topics covered, complete with page numbers where the topics are discussed. Readers looking for information on one small subtopic can check the index to find out which pages to view.
- Footnotes and Endnotes– When footnotes and endnotes list sources, they allow the reader to find and evaluate the information an author is citing.
Emphasizing Concepts
- Formatting Features– Authors may use formatting features such as italics, boldfacing or underlining to emphasize a word, phrase, or other important information in a text.
- Bulleting and numbering– Bullet points and numbered lists set off information and allow readers to scan for bits of information they do not know. It also helps to break down a list of steps.
Presenting Information and Illustrating Ideas
- Graphic Elements– Charts, graphs, diagrams, and other graphic elements present data succinctly, illustrate complex ideas, or otherwise convey information that would be difficult to glean from text alone.
- Bulleting and numbering– Bullet points and numbered lists set off information and allow readers to scan for bits of information they do not know. It also helps to break down a list of steps.
Providing Peripheral Information
- Sidebars– Sidebars are text boxes that contain information related to the topic but not essential to the overall point.
- Footnotes and Endnotes– Some footnotes and endnotes contain information that is not essential to the development of the main point but may nevertheless interest readers and researchers.1
1Anthony Grafton’s book The Footnote: A Curious History is an in-depth history of the origins and development of the footnote. (Also, this is an example of a footnote.)
Maps and Charts
To read maps and charts, you need to understand what the labels, symbols, and pictures mean. You also need to know how to make decisions using the information they contain.
Maps
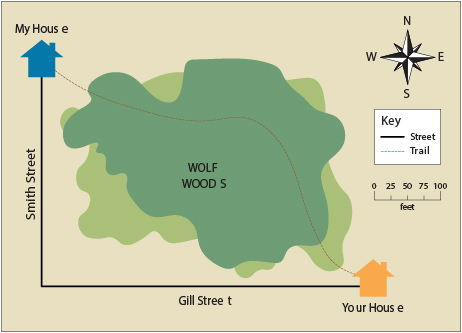
Maps are stylized pictures of places as seen from above. A map may have a box labeled “Key” or “Legend” that provides information about the meanings of colors, lines, or symbols. On the map below, the key shows that a solid line is a road and a dotted line is a trail.
There may also be a line labeled “scale” that helps you figure out how far you need to travel to get from one point on the map to another. In the example below, an inch is only 100 feet, so a trip from one end to the other is not far.

Some maps, including the example above, have compasses that show directions. If no compass is pictured, assume the top of the map is north.
Charts
Nutrition Facts Labels
Nutrition facts labels are charts many people see daily, but not everyone knows how to read them. The top third of the label lists calorie counts, serving sizes, and amount of servings in a package. If a package contains more than one serving, a person who eats the entire contents of the package may be consuming many times the number of calories listed per serving.
The label below lists the content of nutrients such as fats and carbohydrates, and so on. According to the label, a person who eats one serving of the product in the package will ingest 30 mg of cholesterol, or 10% of the total cholesterol he or she should consume in a day.

| KEEP IN MIND . . . The percentages on a Nutrition Facts label do not (and are not meant to) add up to 100. Instead, they show how much of a particular nutrient is contained in a serving of the product, as a proportion of a single person’s Daily Value for that nutrient. The Daily Value is the total amount of a nutrient a person is supposed to eat in a day, based on a 2000-calorie diet. In general, a percentage of 5% or less is considered low, whereas a percentage of 20% or more is considered high. A higher percentage can be good or bad, depending on whether or not a person should be trying to get more of a particular ingredient. People need to get plenty of vitamins, minerals, and fiber. In contrast, most people need to limit their intake of fat, cholesterol, and sodium. |
Tables
Tables organize information into vertical columns and horizontal rows. Below is a table that shows how much water falls on areas of various sizes when it rains one inch. It shows, for instance, that a 40’x70’ roof receives 1,743 gallons of rain during a one-inch rainfall event.

Let’s Review!
- Readers must understand how and why text features make certain information stand out from the text.
- Readers must understand and interpret the content of maps and charts.
Subscribe to the online course to gain access to the full lesson content.
If your not ready for a subscription yet, be sure to check out our free practice tests and sample lesson at this link
